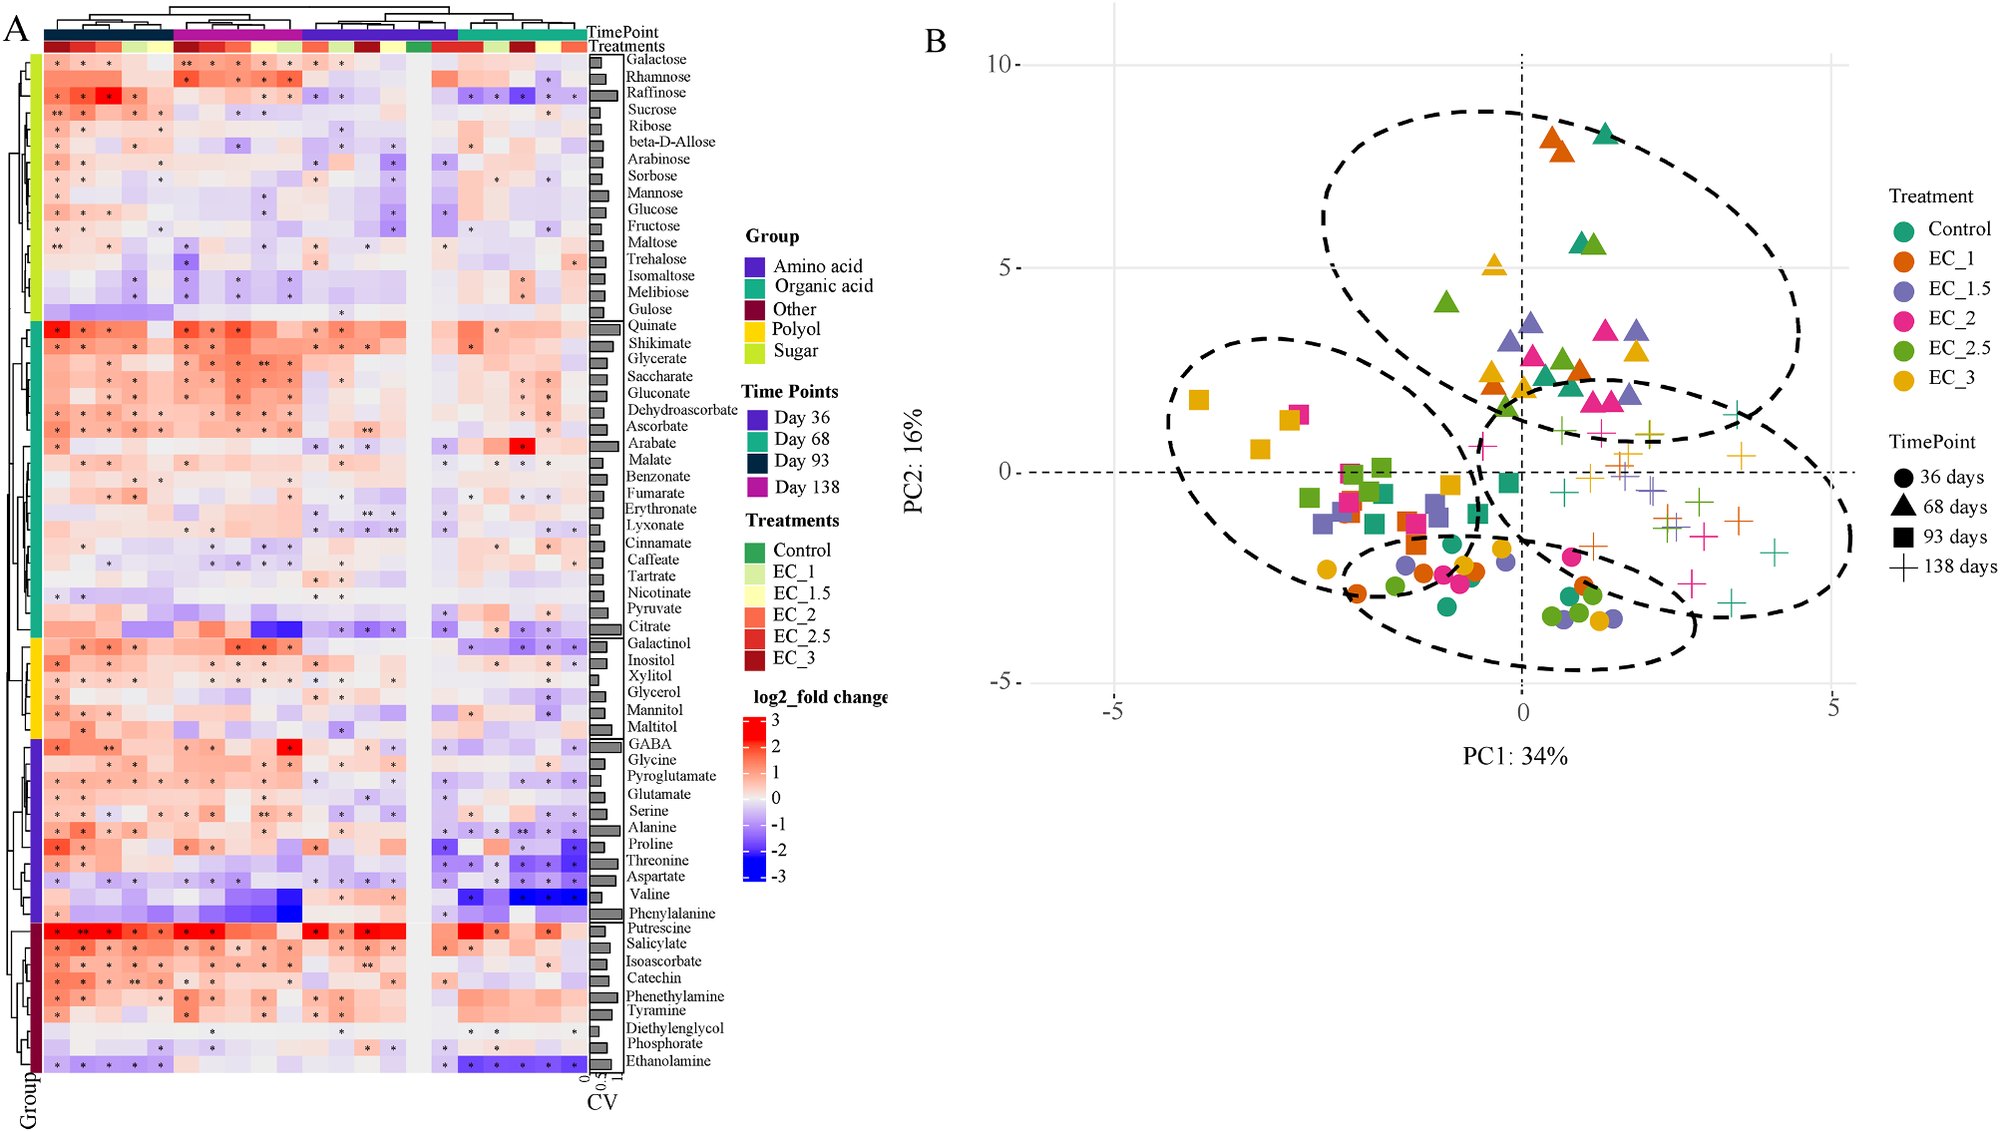
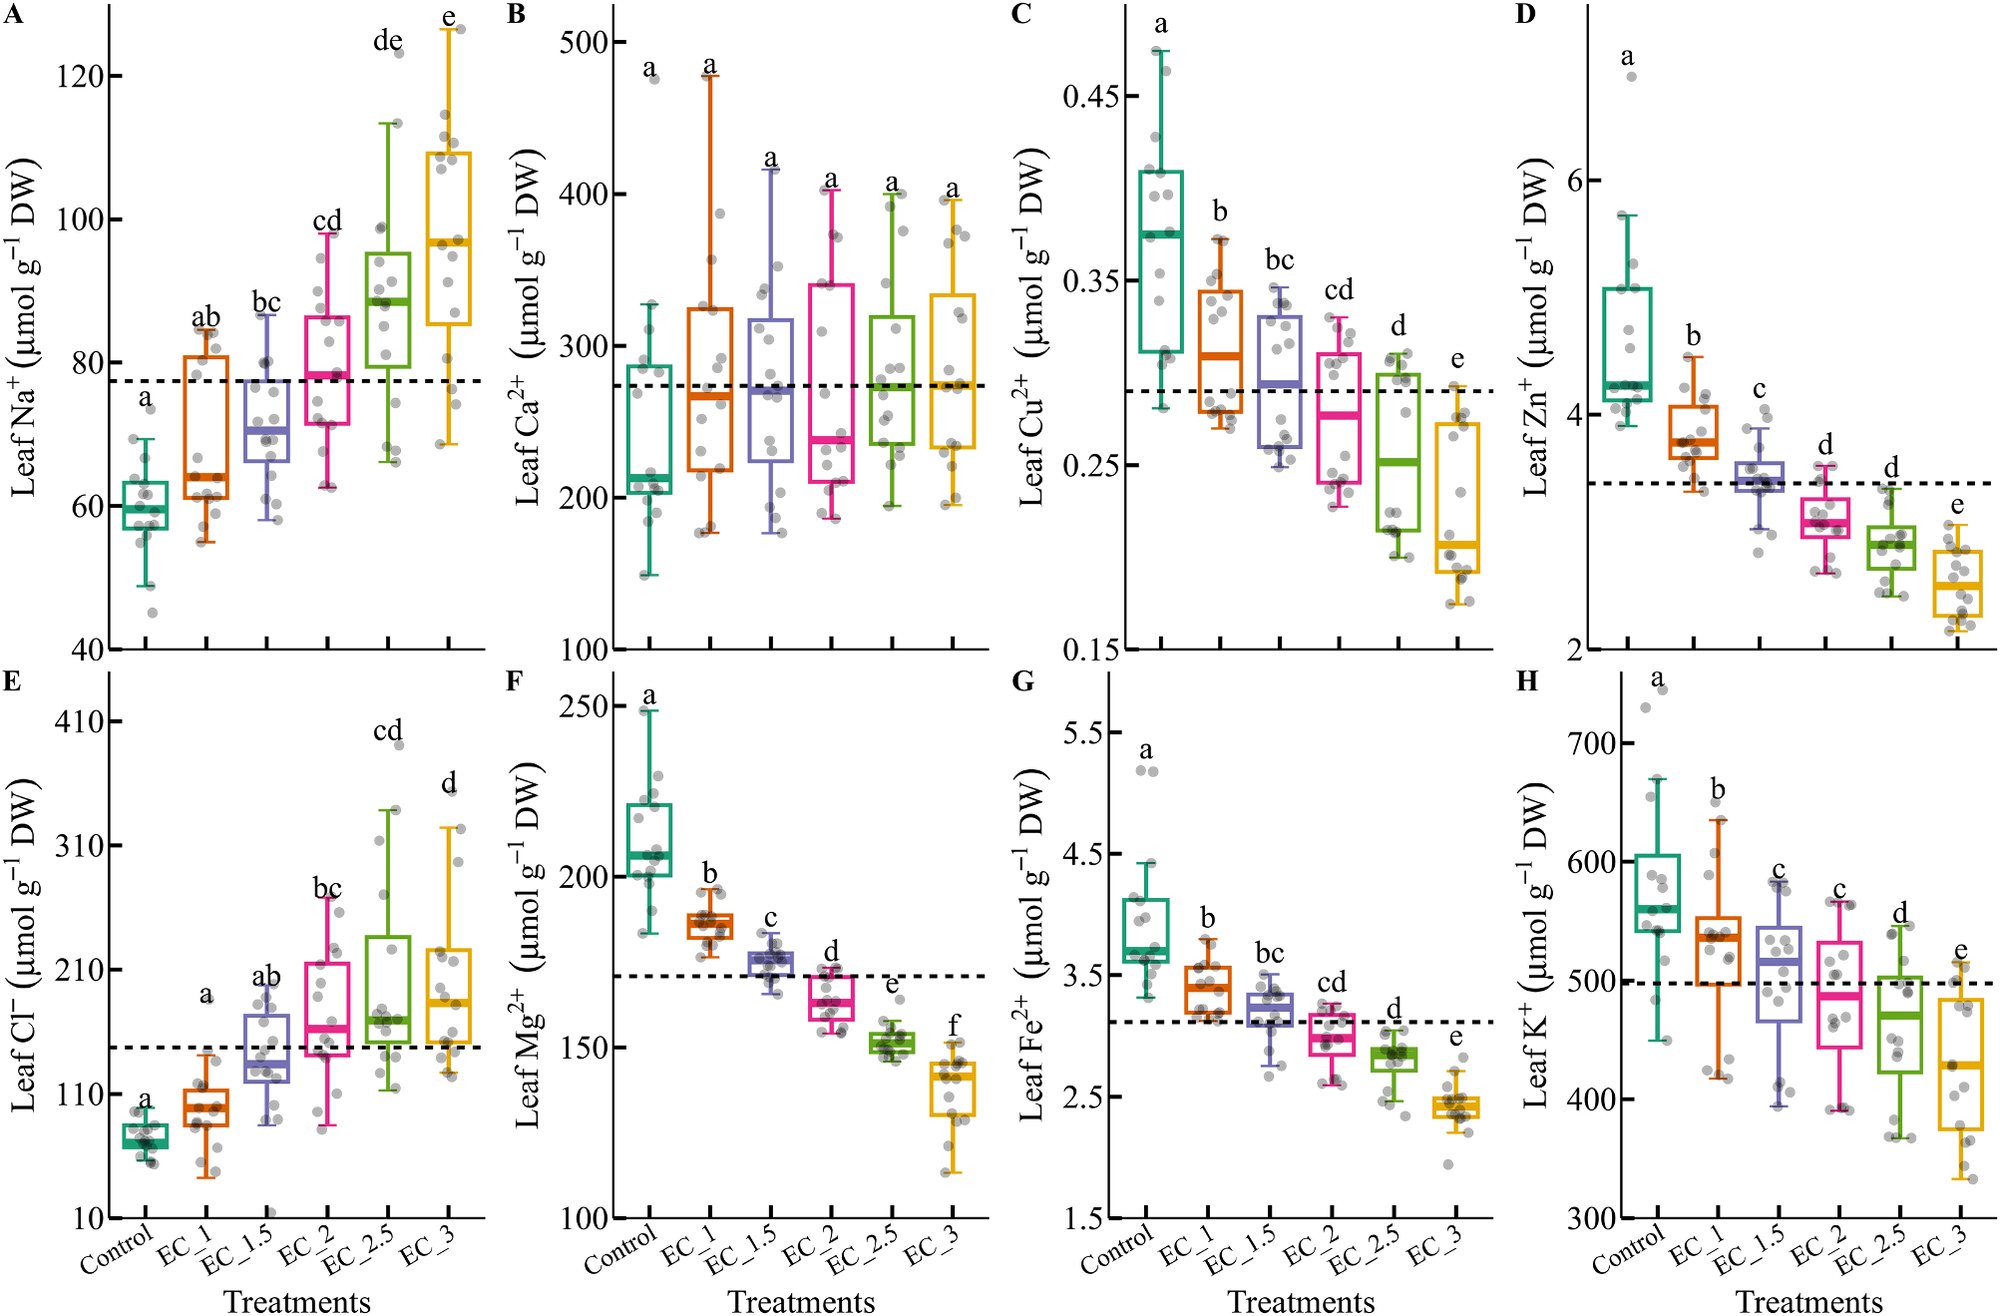
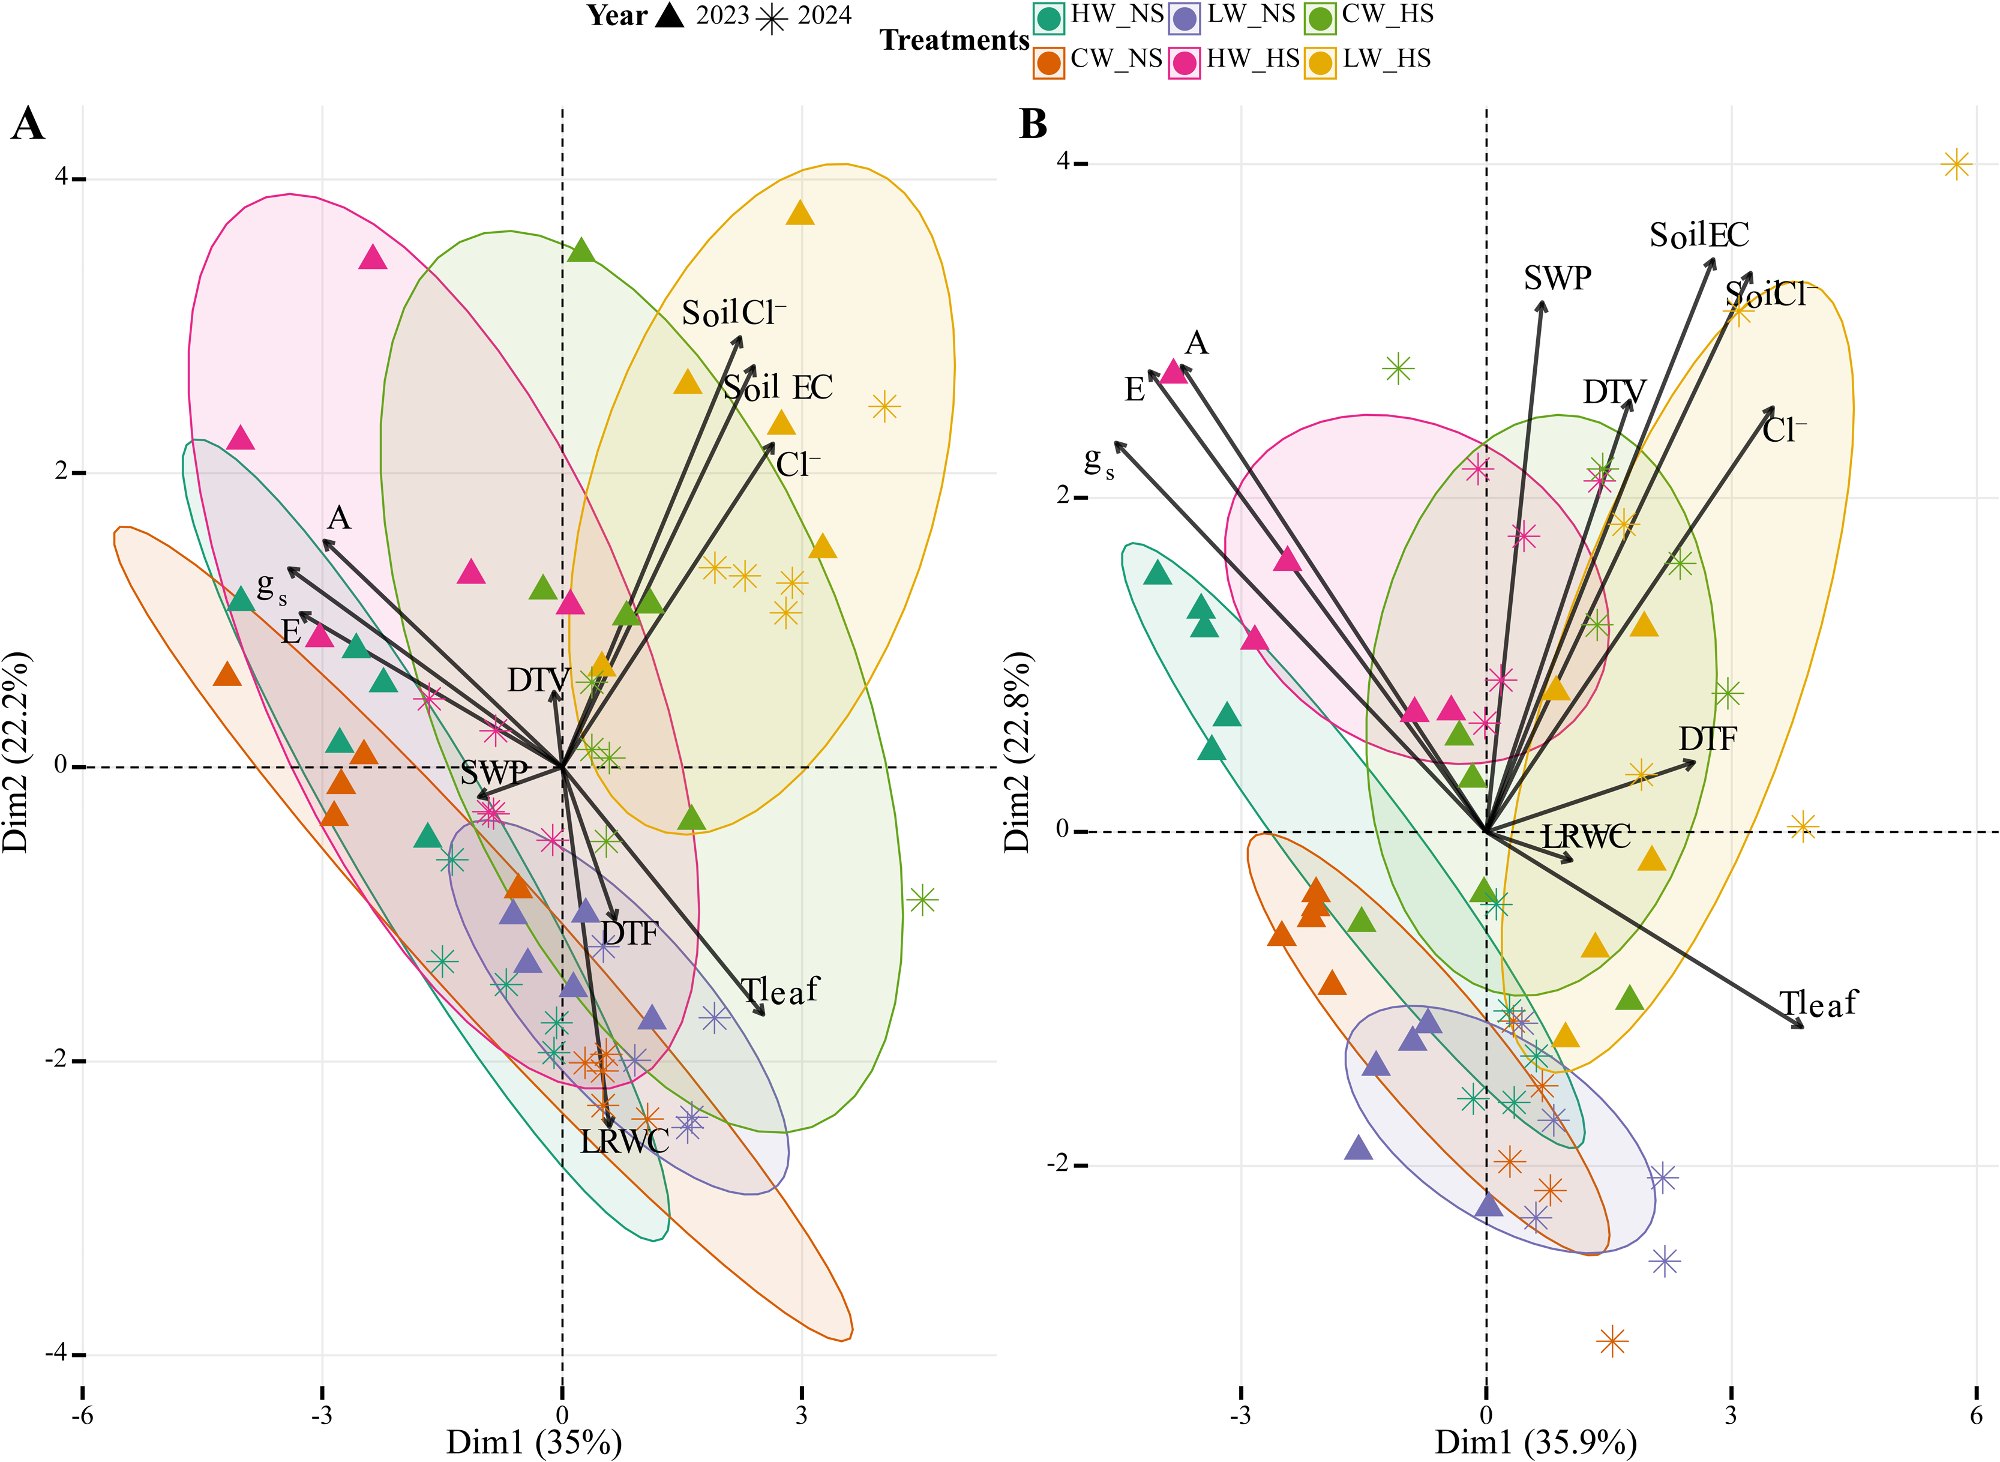
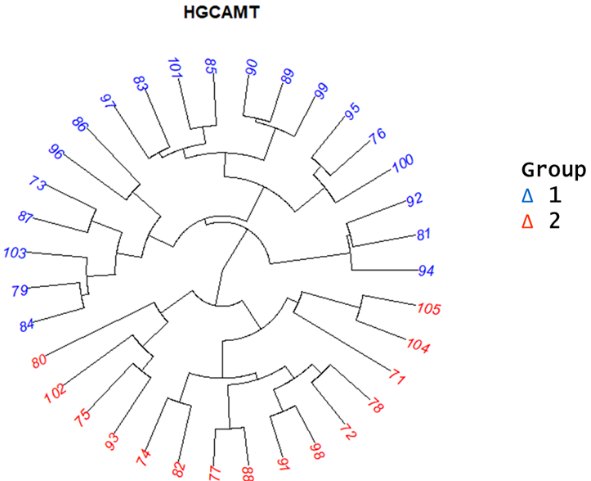
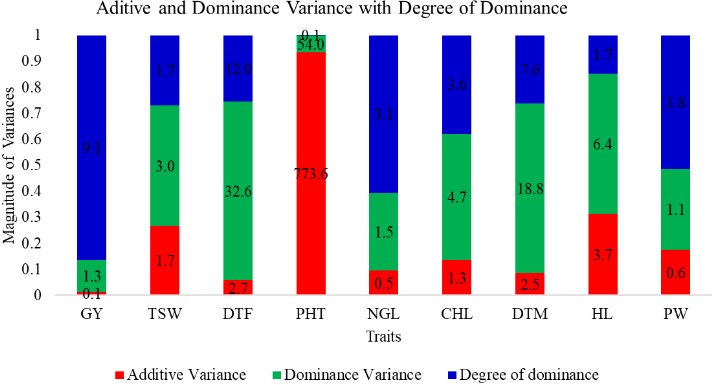
Figures from published papers, from leaf metabolism to vineyard climate and sorghum trials.
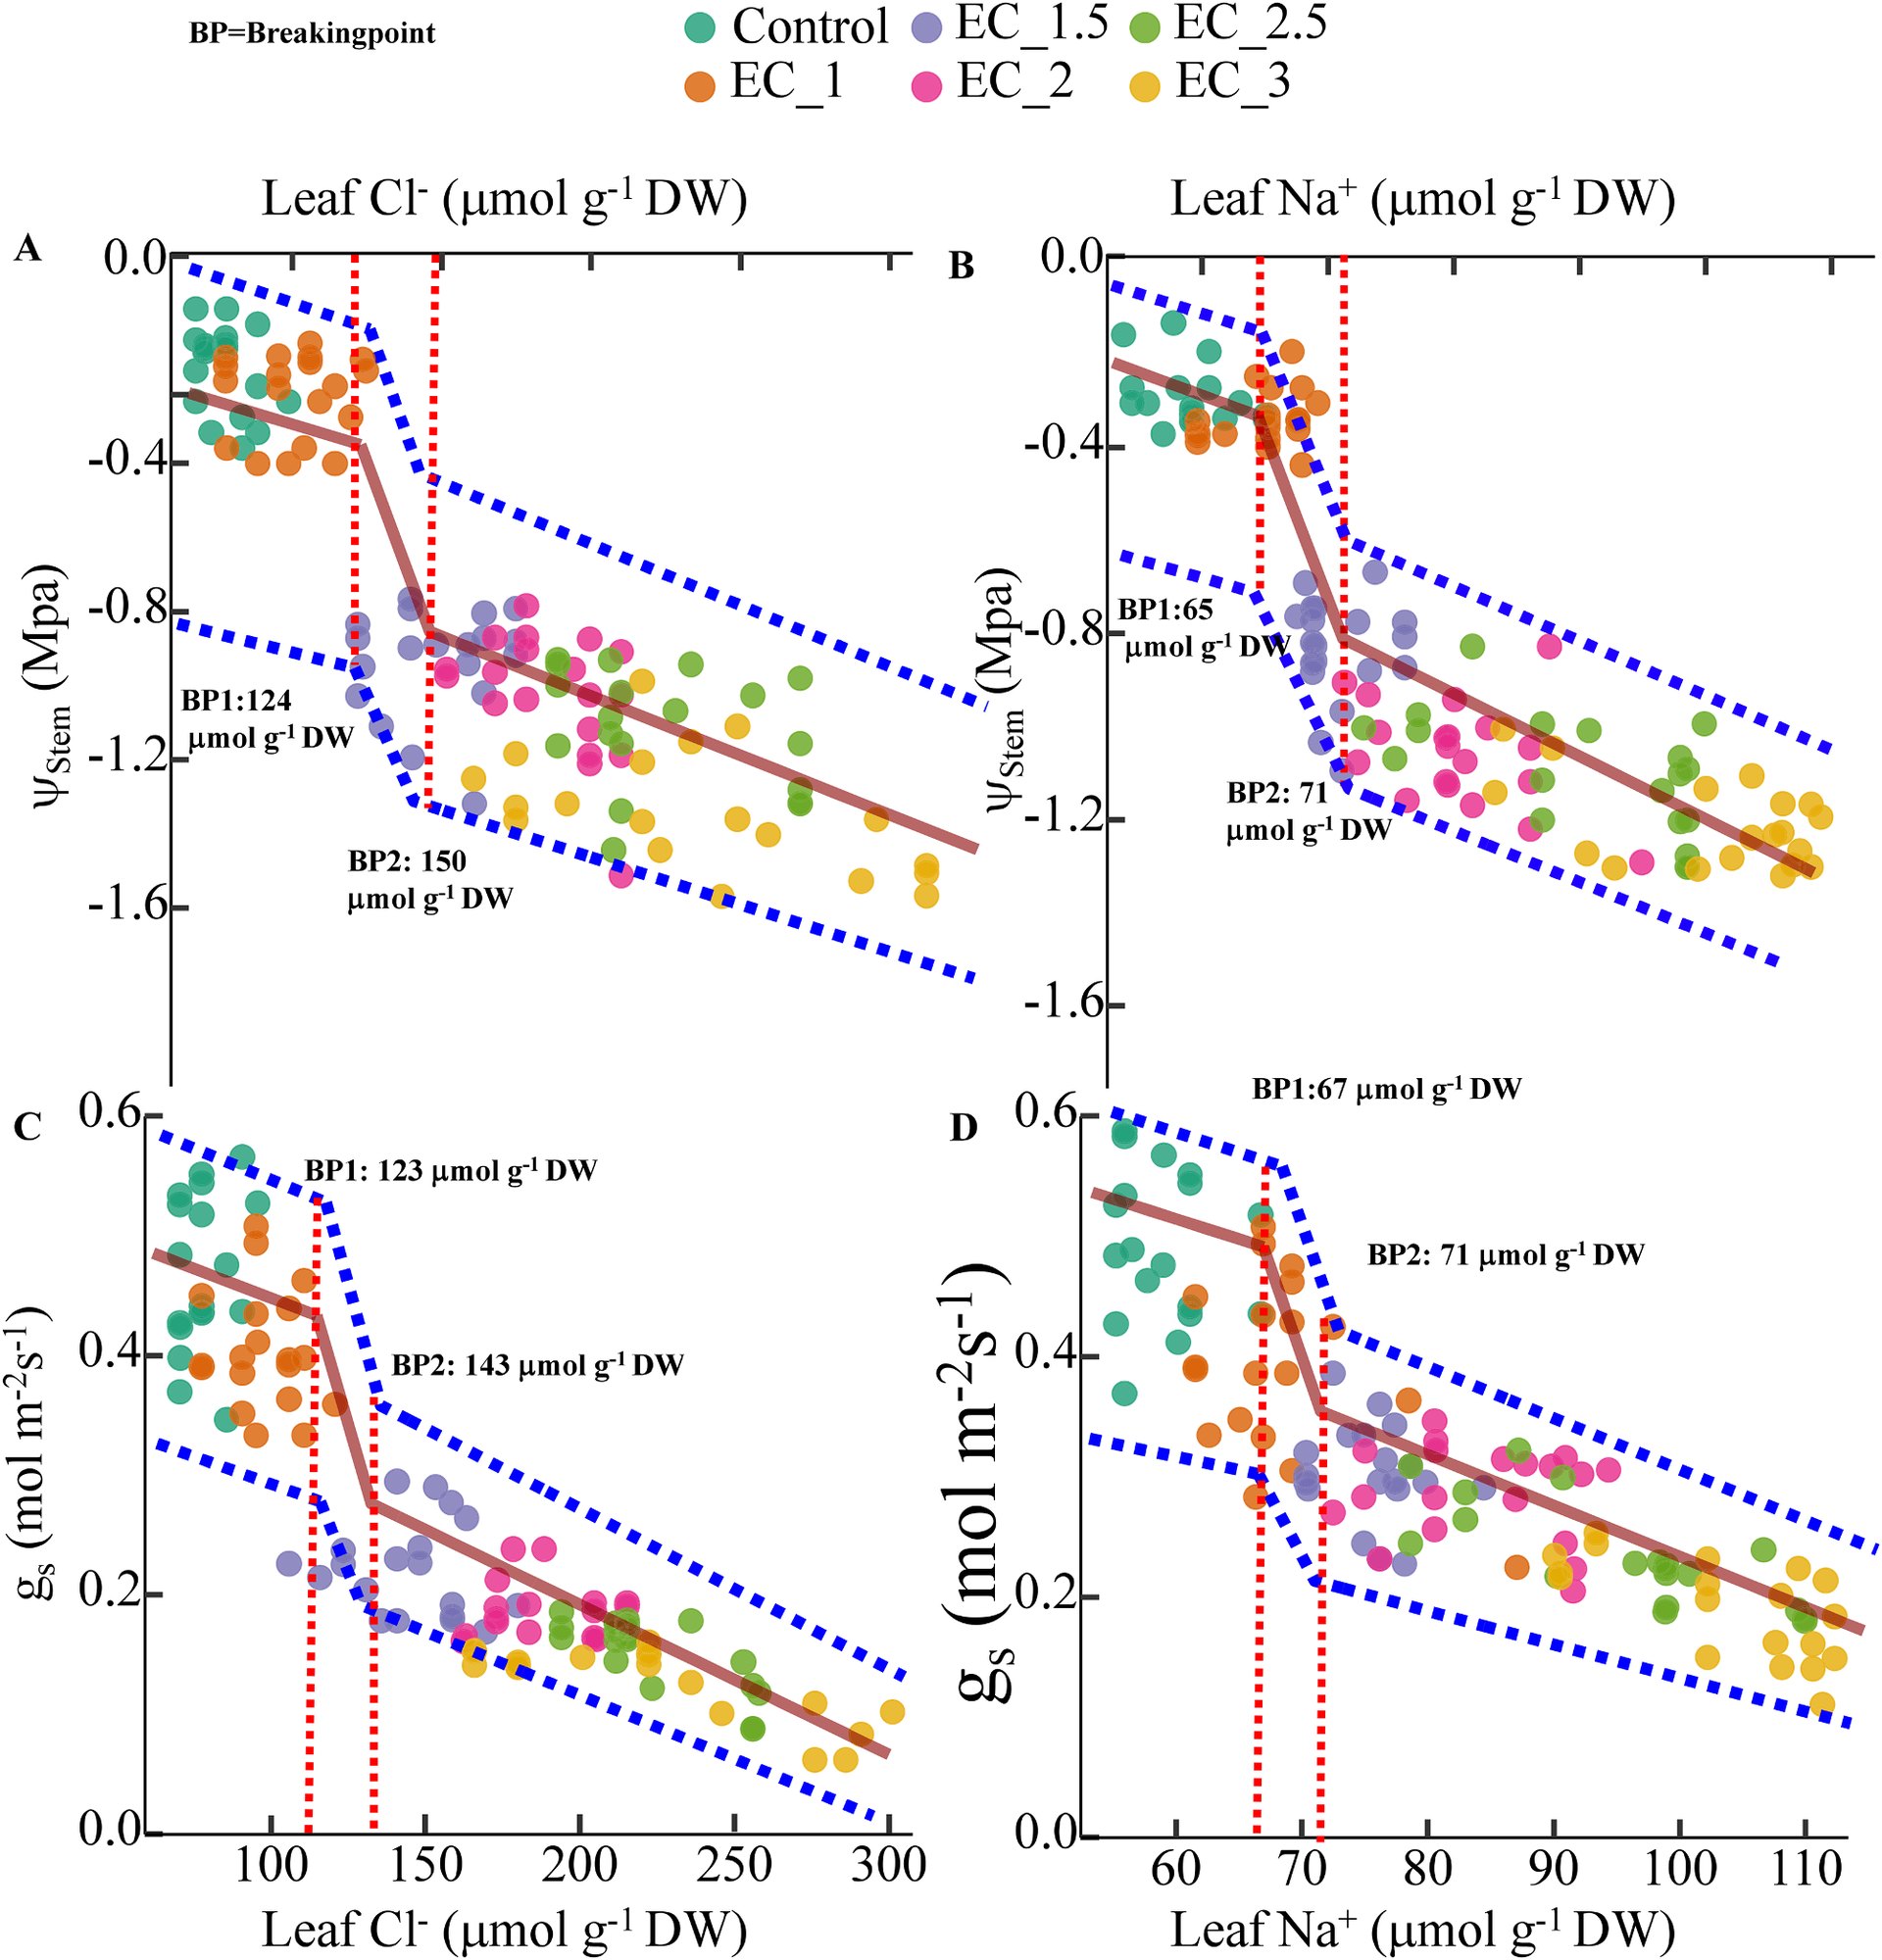
Plant Stress · 2025 · Fig. 4Leaf chloride and sodium set breakpoints for water status and stomatal conductanceSegmented regression of stem water potential and stomatal conductance against leaf Cl⁻ and Na⁺. Two breakpoints mark where Syrah shifts into a stress-response mode.
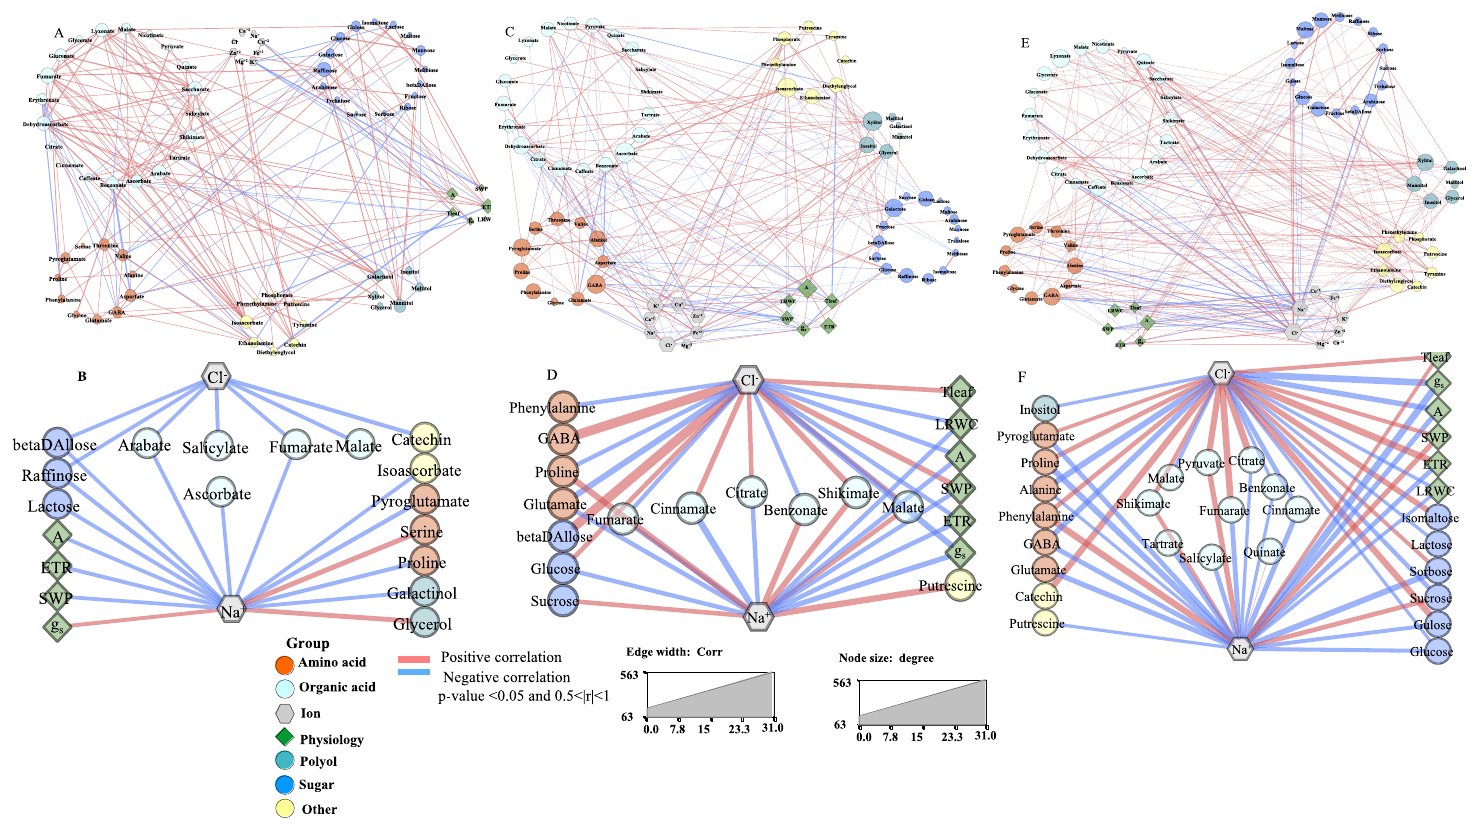
Plant Stress · 2025 · Fig. 6Salinity rewires the links between ions, metabolites and physiologyCorrelation and bipartite networks of leaf metabolites, ions and physiological traits under control, low and high salinity.
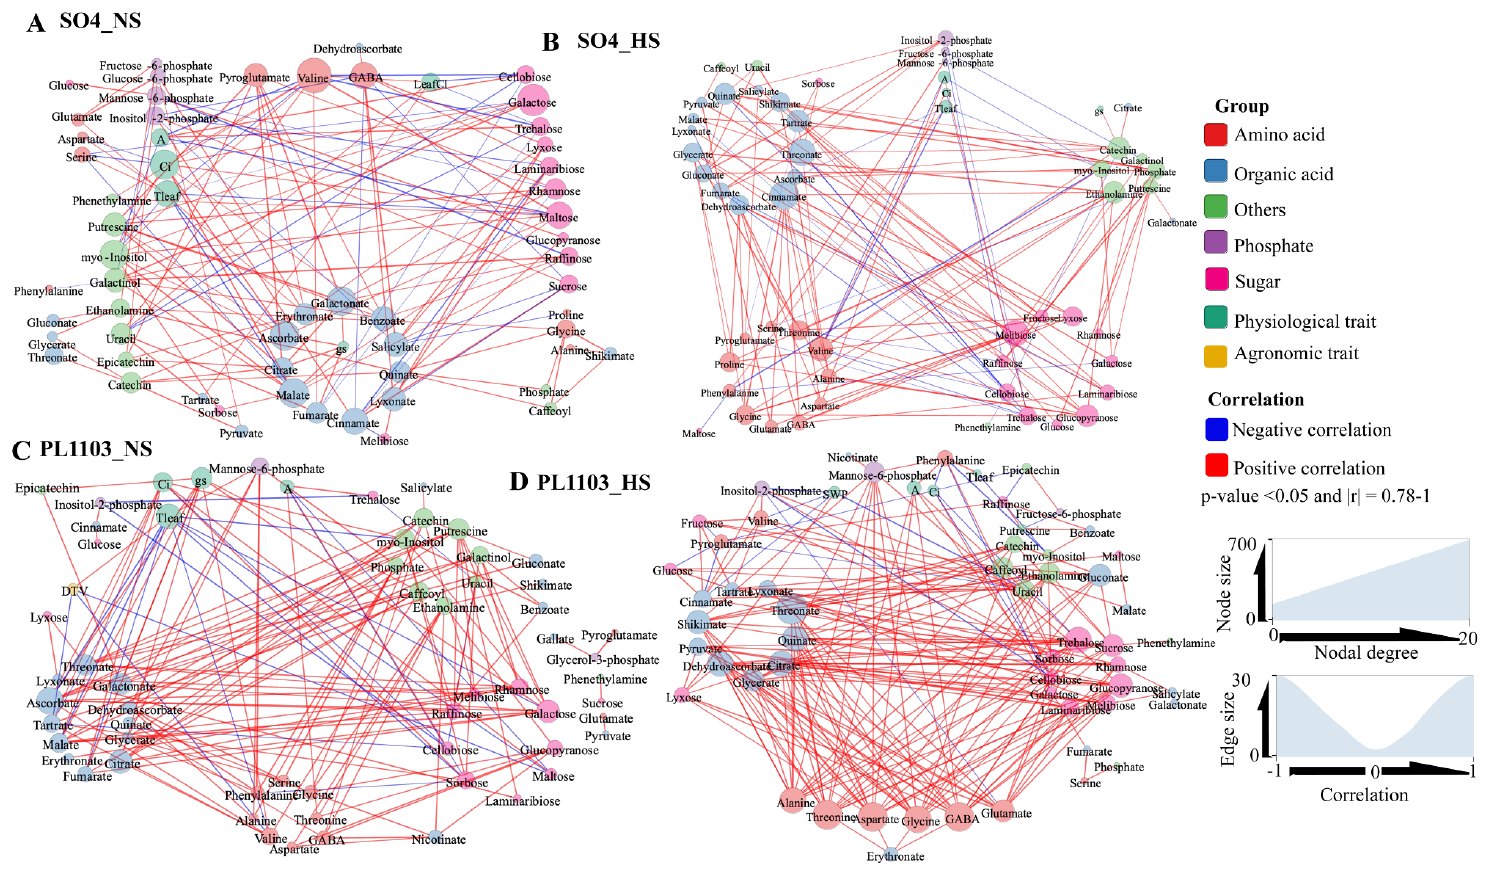
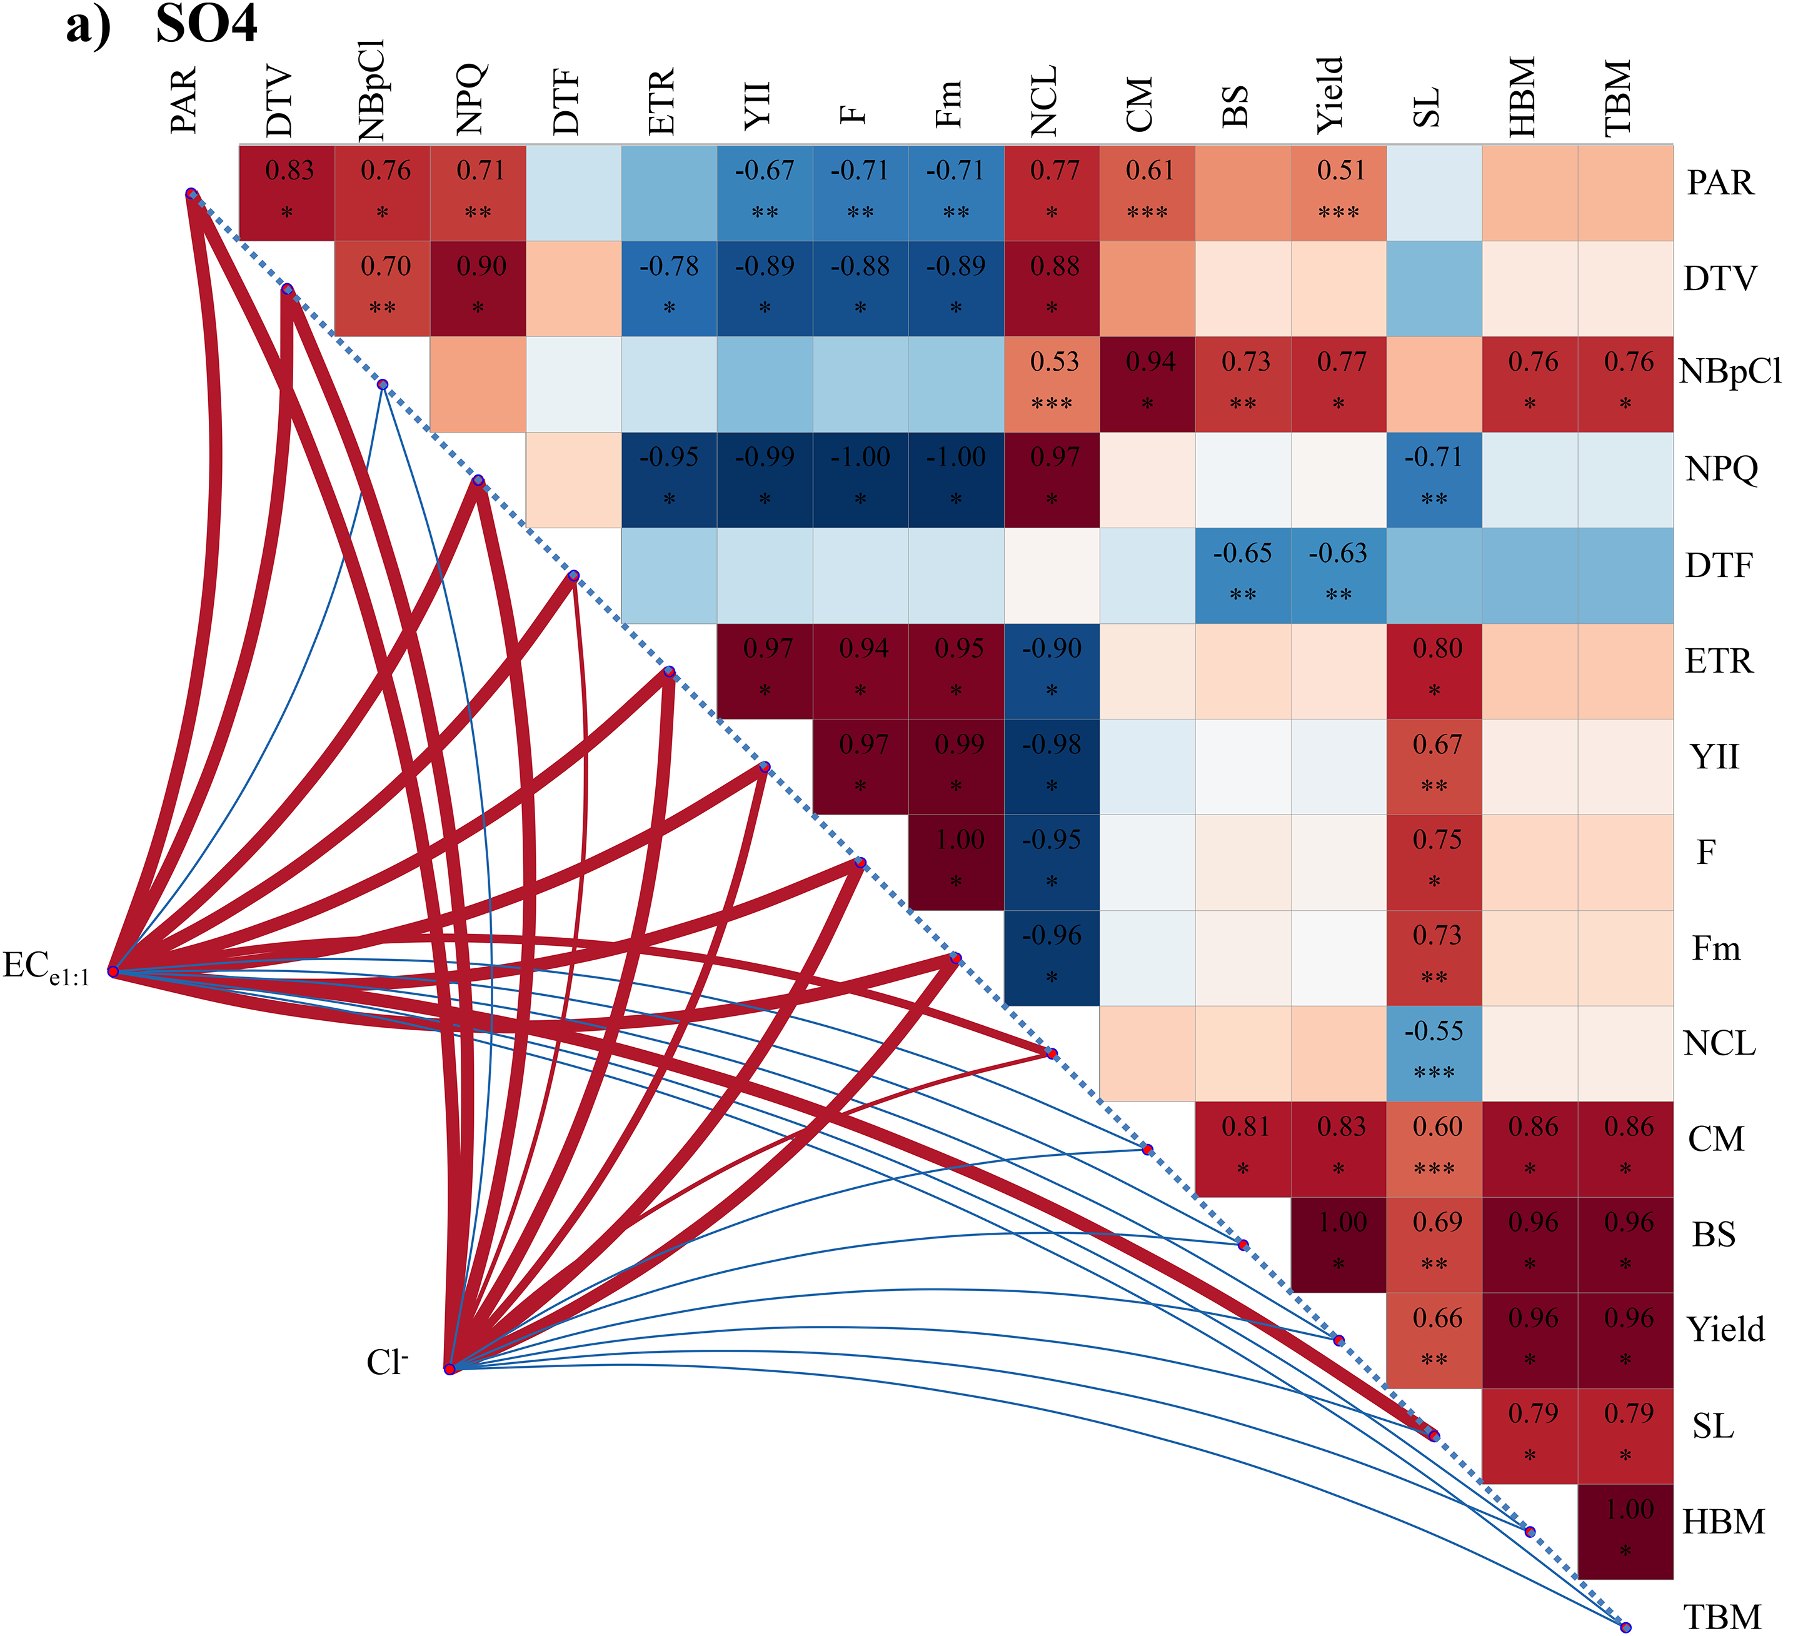
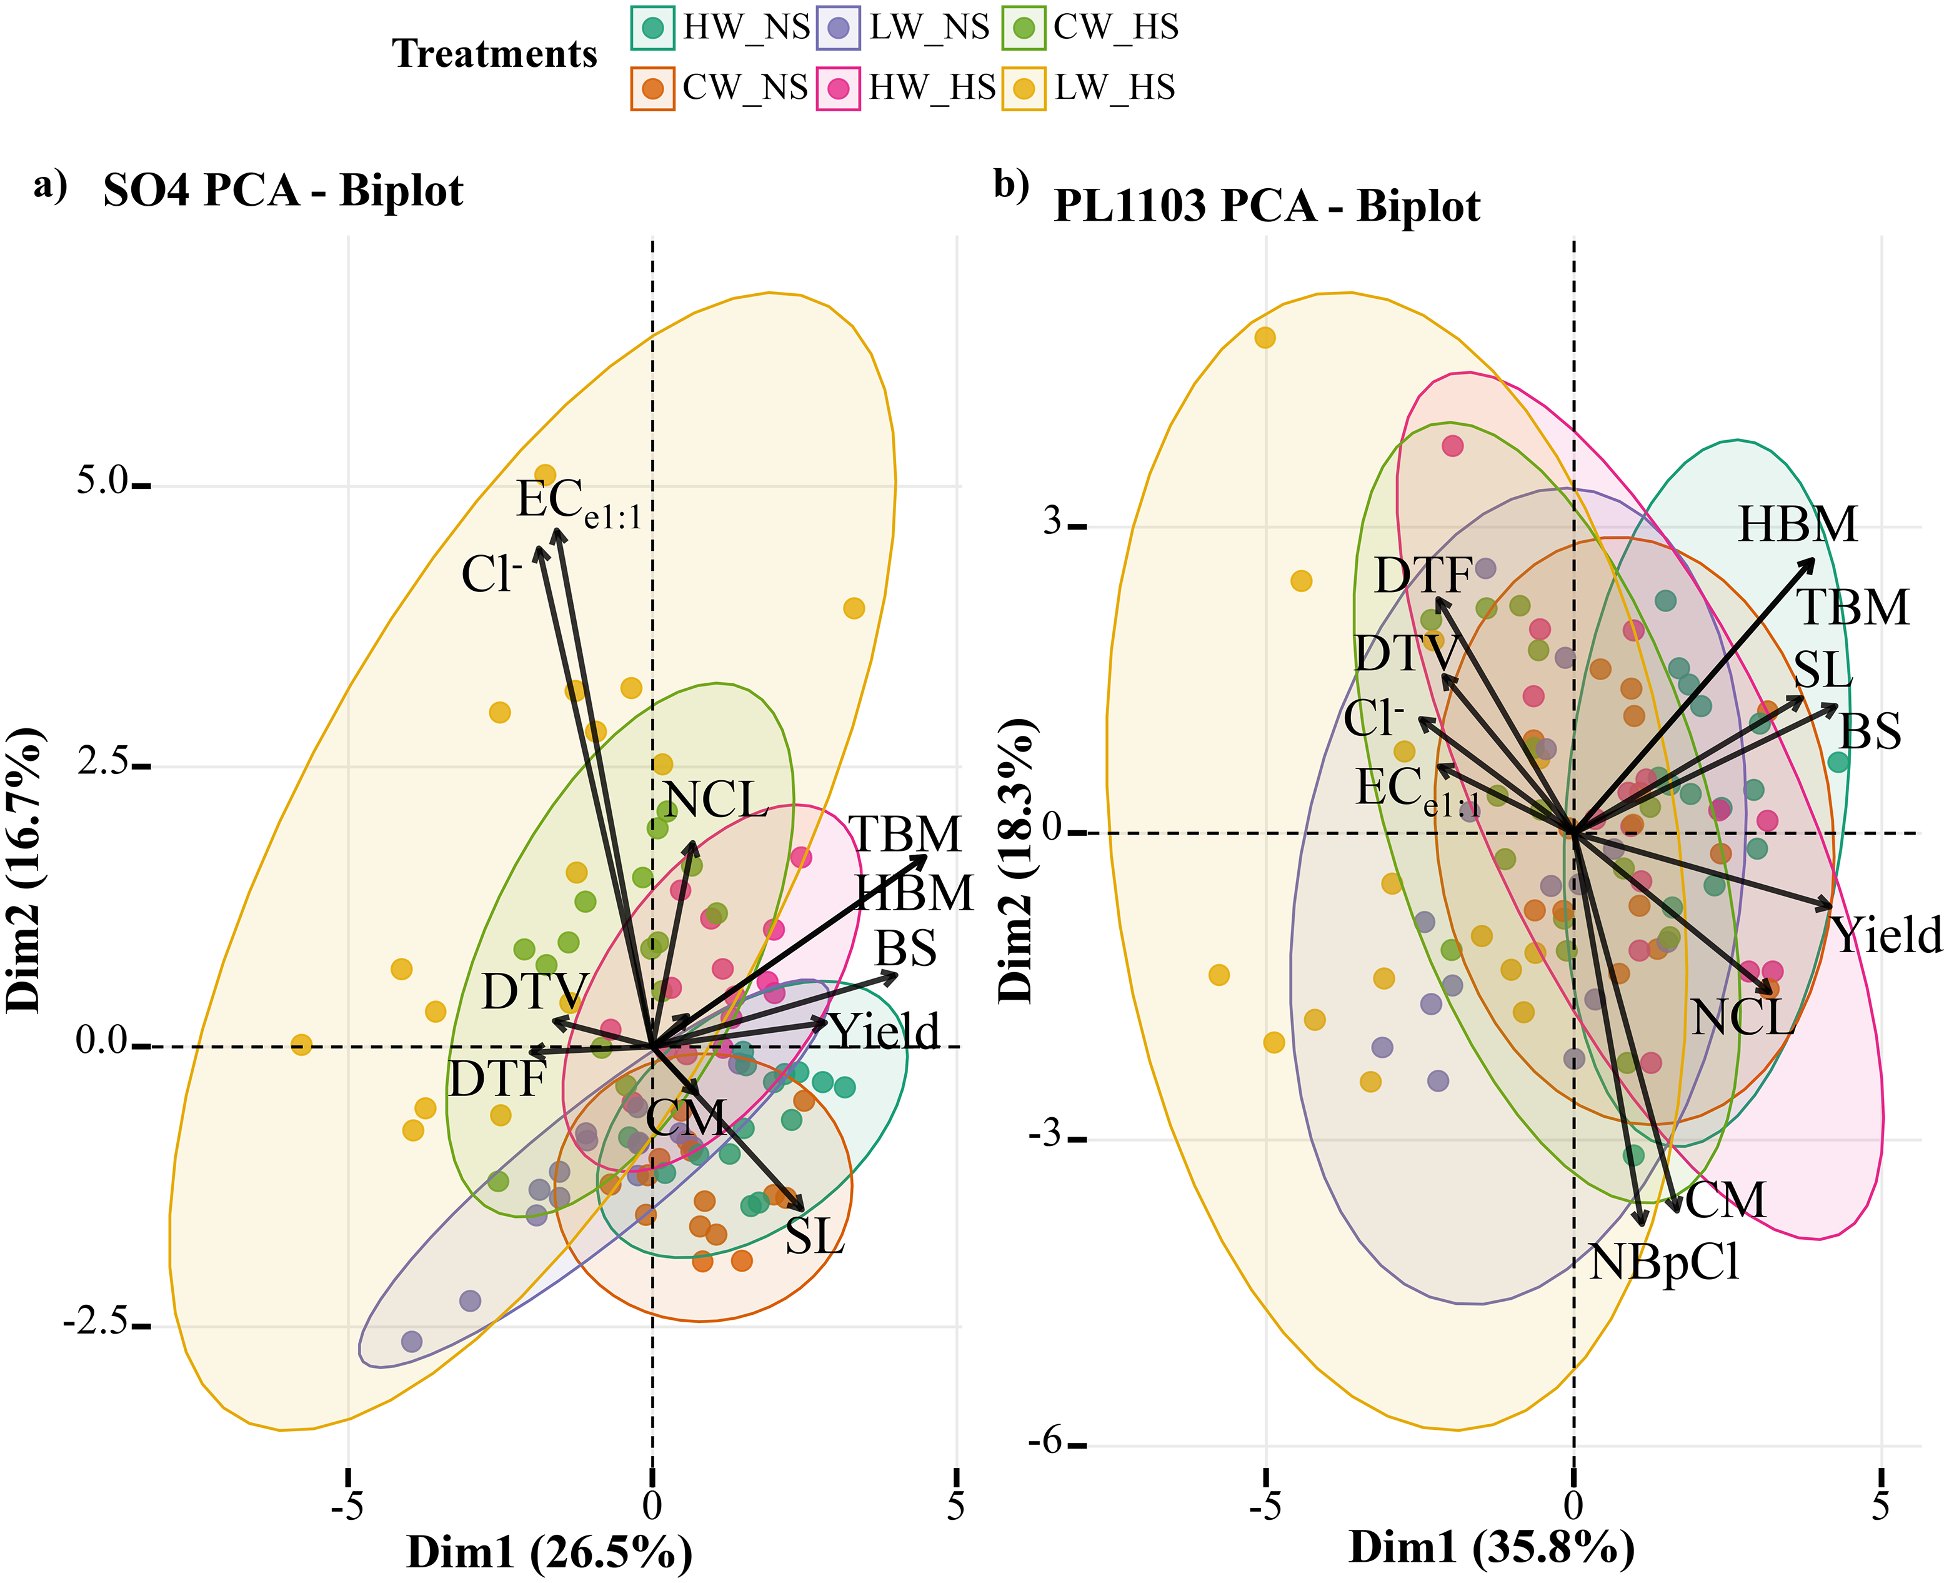
Plant Stress · 2026 · Fig. 7Rootstocks decide how metabolism and physiology stay coordinated under salinityCorrelation networks of central metabolites, physiological and agronomic traits in Syrah grafted on SO4 and PL1103, under non-saline and high-saline conditions.
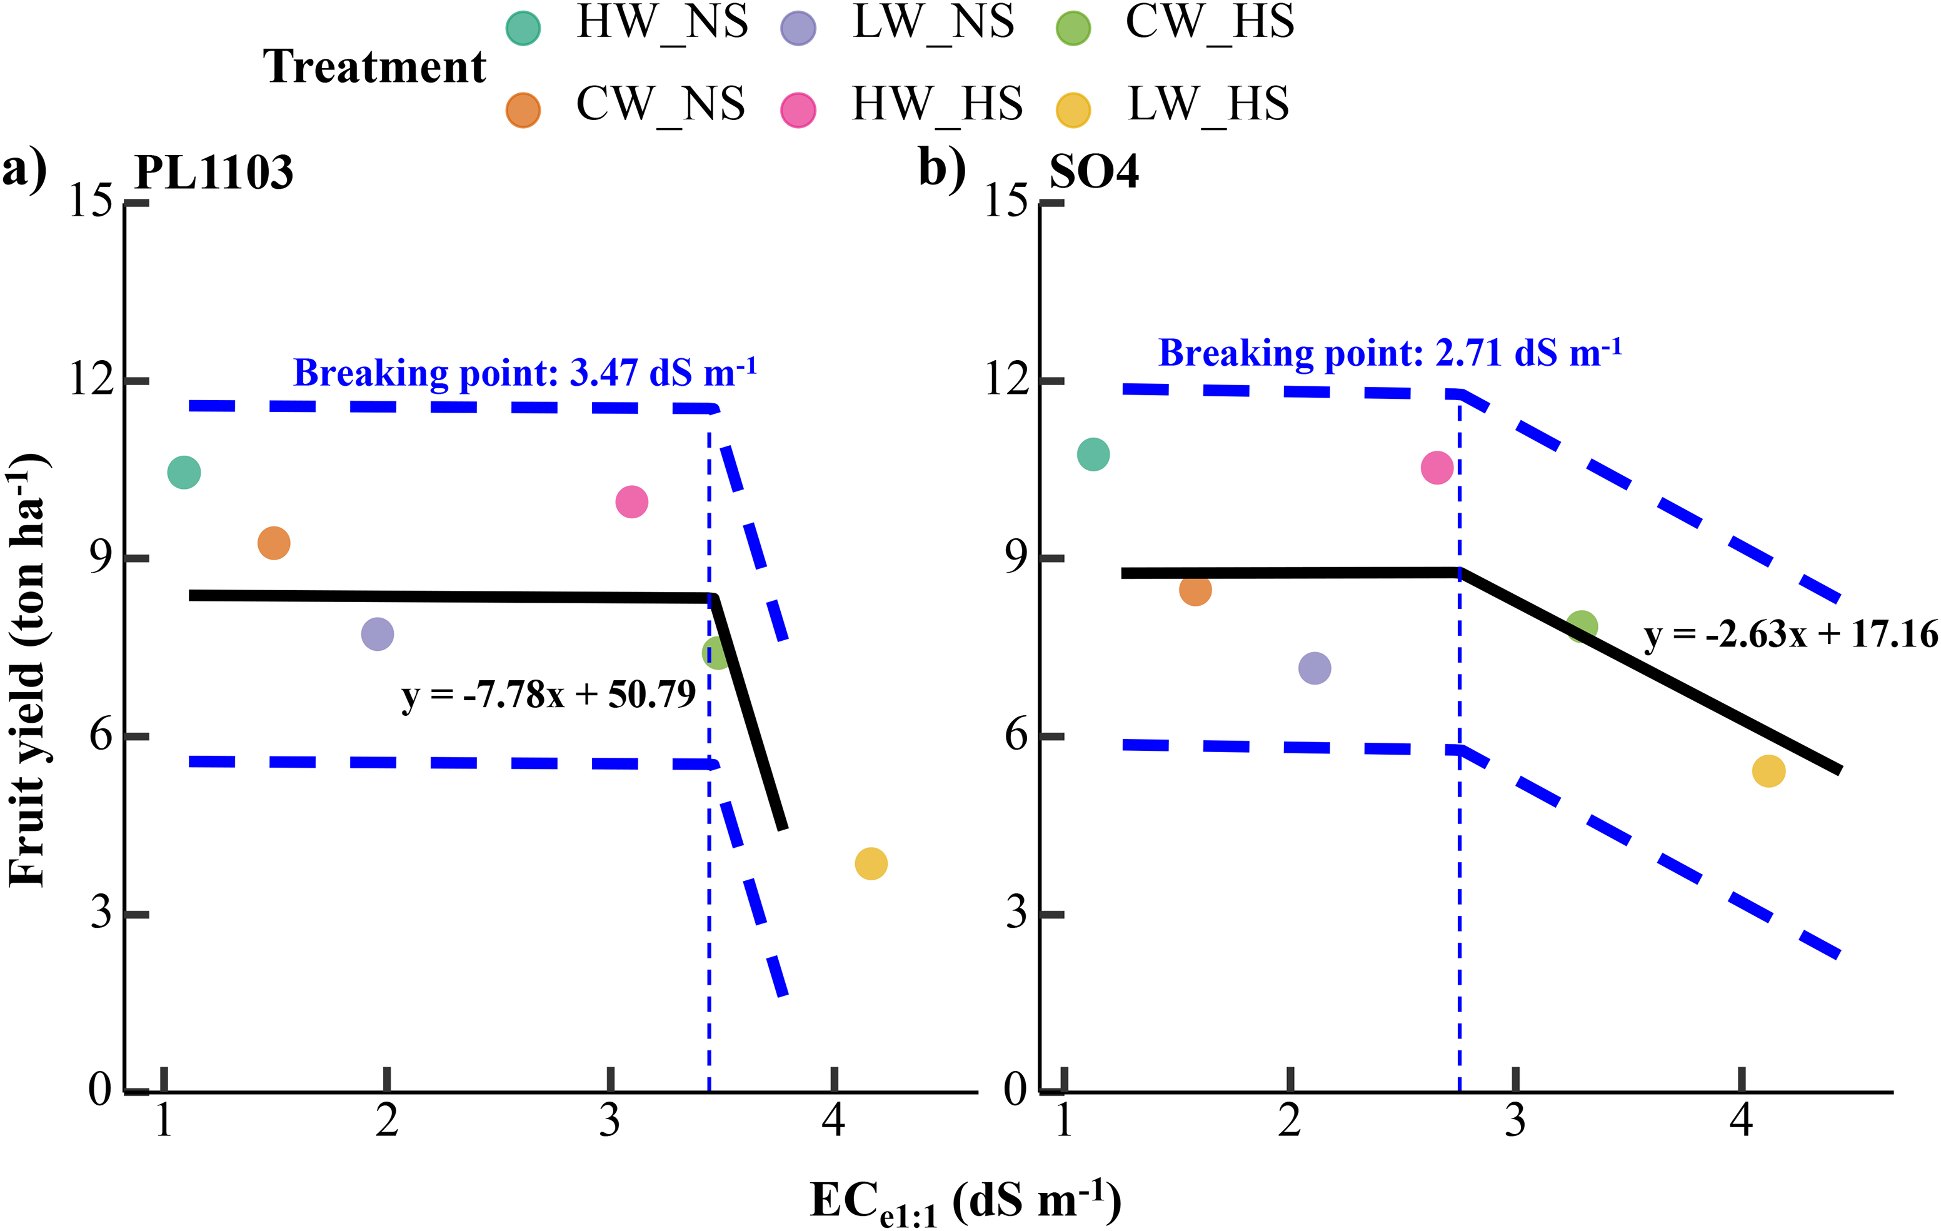
Plant Stress · 2025 · Fig. 8Yield falls beyond a rootstock-specific soil salinity thresholdMaas-Hoffman piecewise regression of fruit yield on soil salinity. The breakpoint sits at 3.47 dS m⁻¹ for PL1103 and 2.71 dS m⁻¹ for SO4.
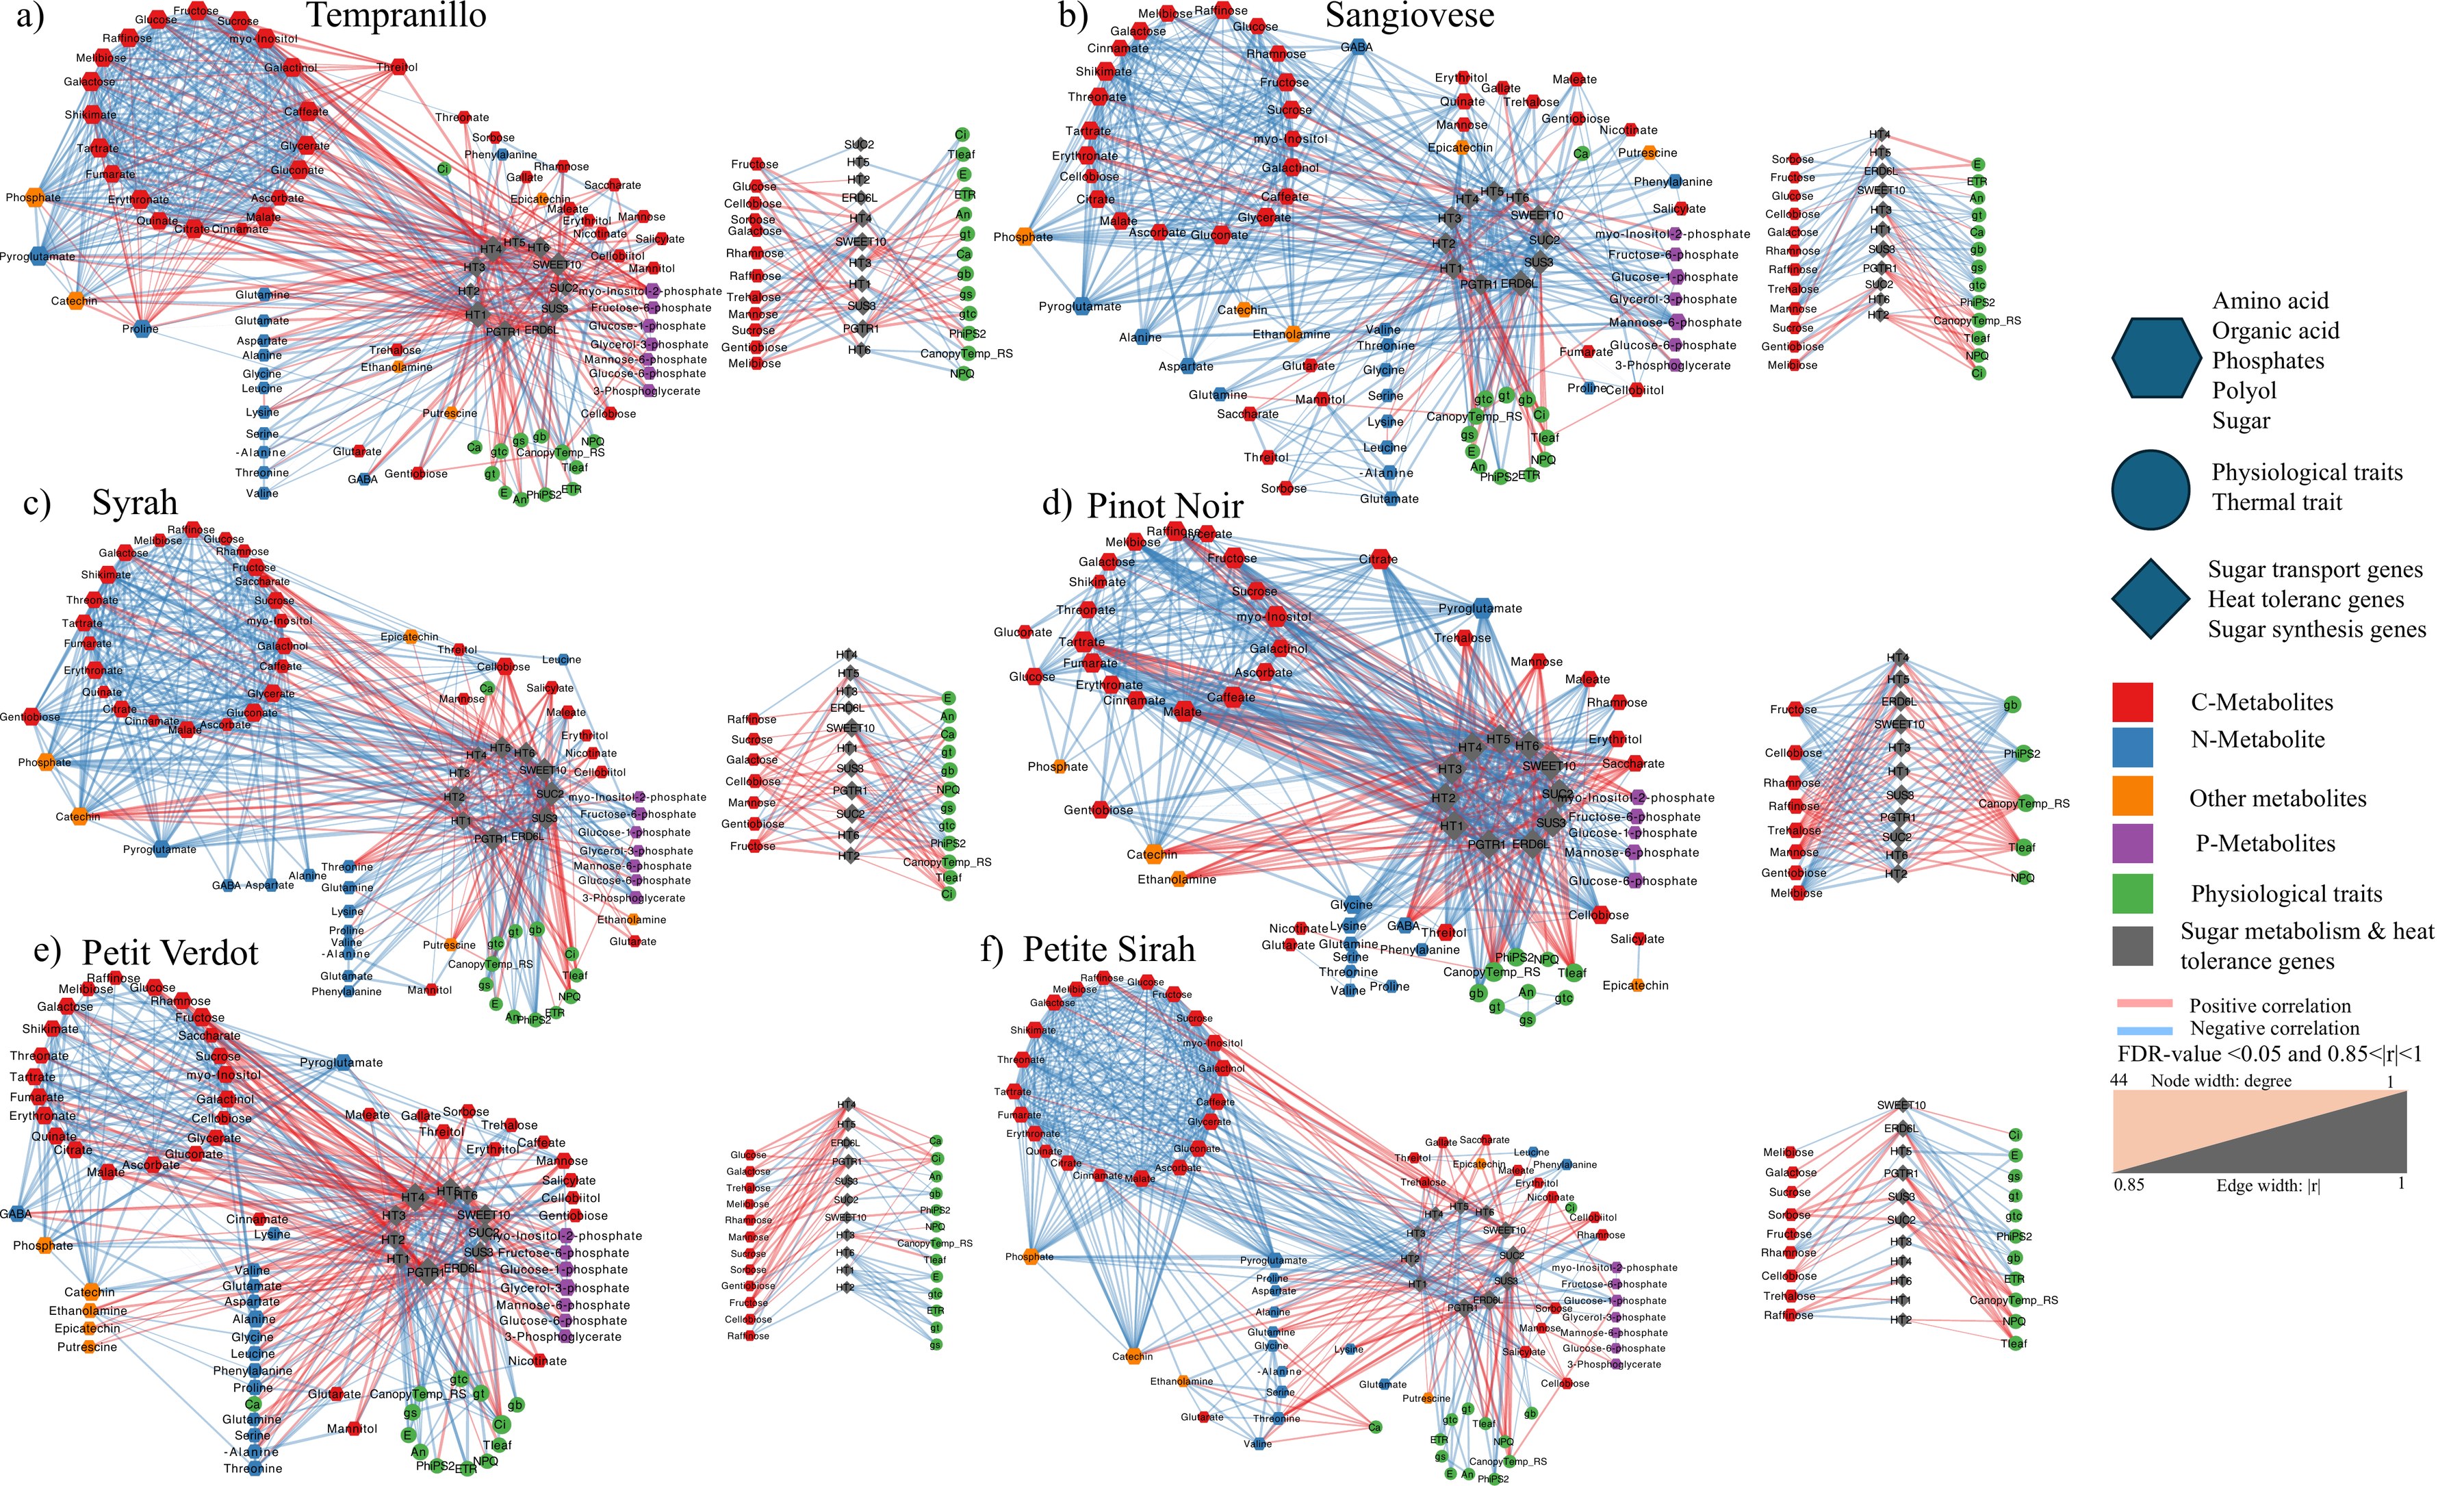
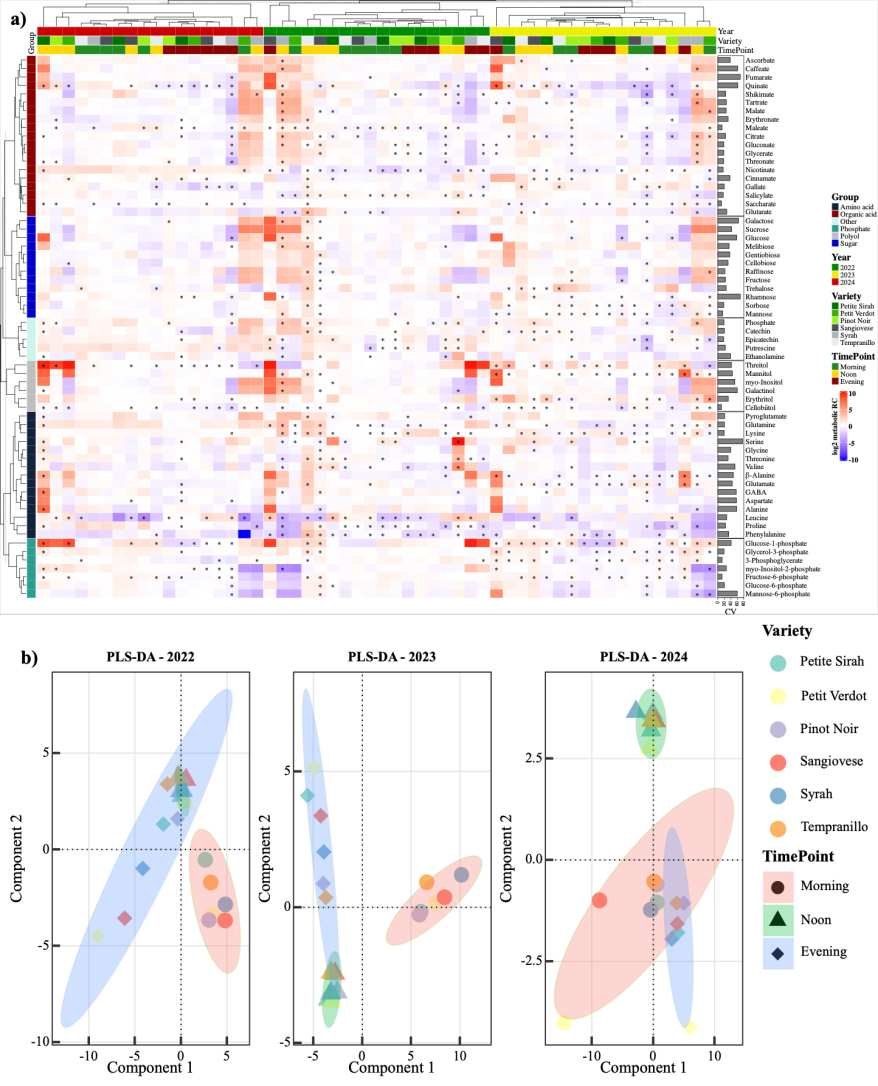
Preprint, under review · 2026 · Figure 8Each grape variety builds its own heat-stress networkCorrelation networks linking metabolites, canopy temperature, sugar metabolism genes and physiology in the leaves of six red grapevine varieties.
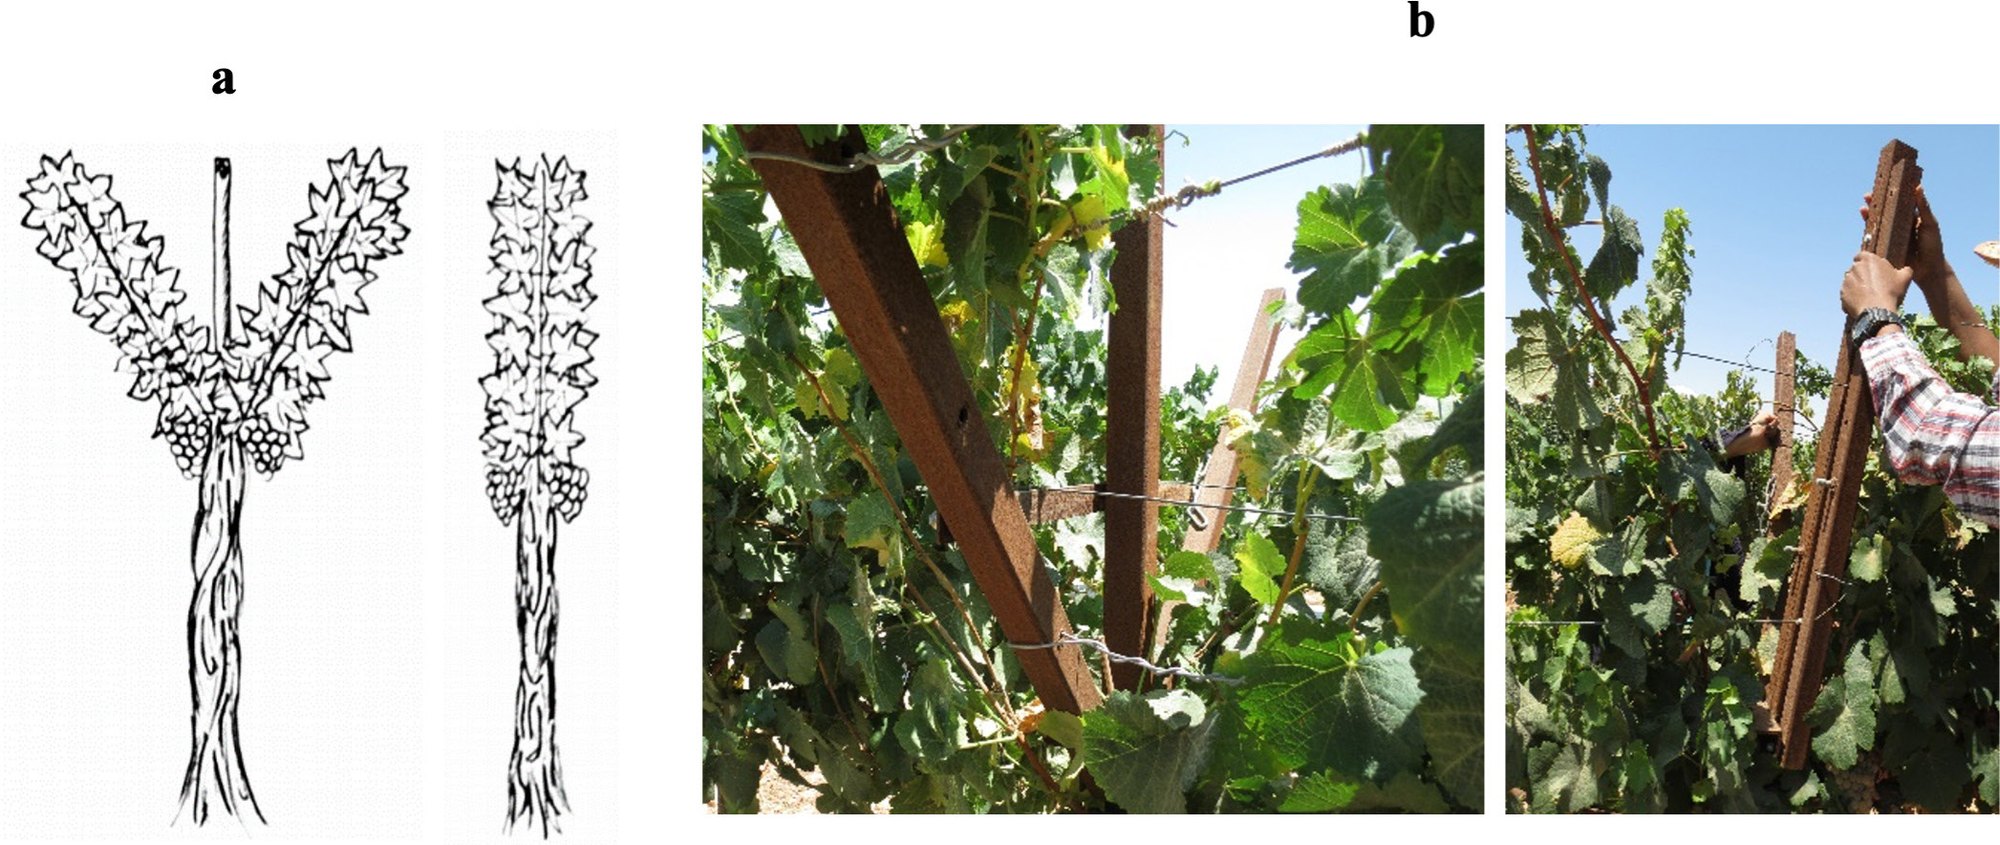
OENO One · 2024 · Figure 1A Y-shaped canopy for Gewurztraminer in an arid climateIn-row drawings of the SAYM and VSP training systems, with photos of the open Y structure and its closing after harvest.
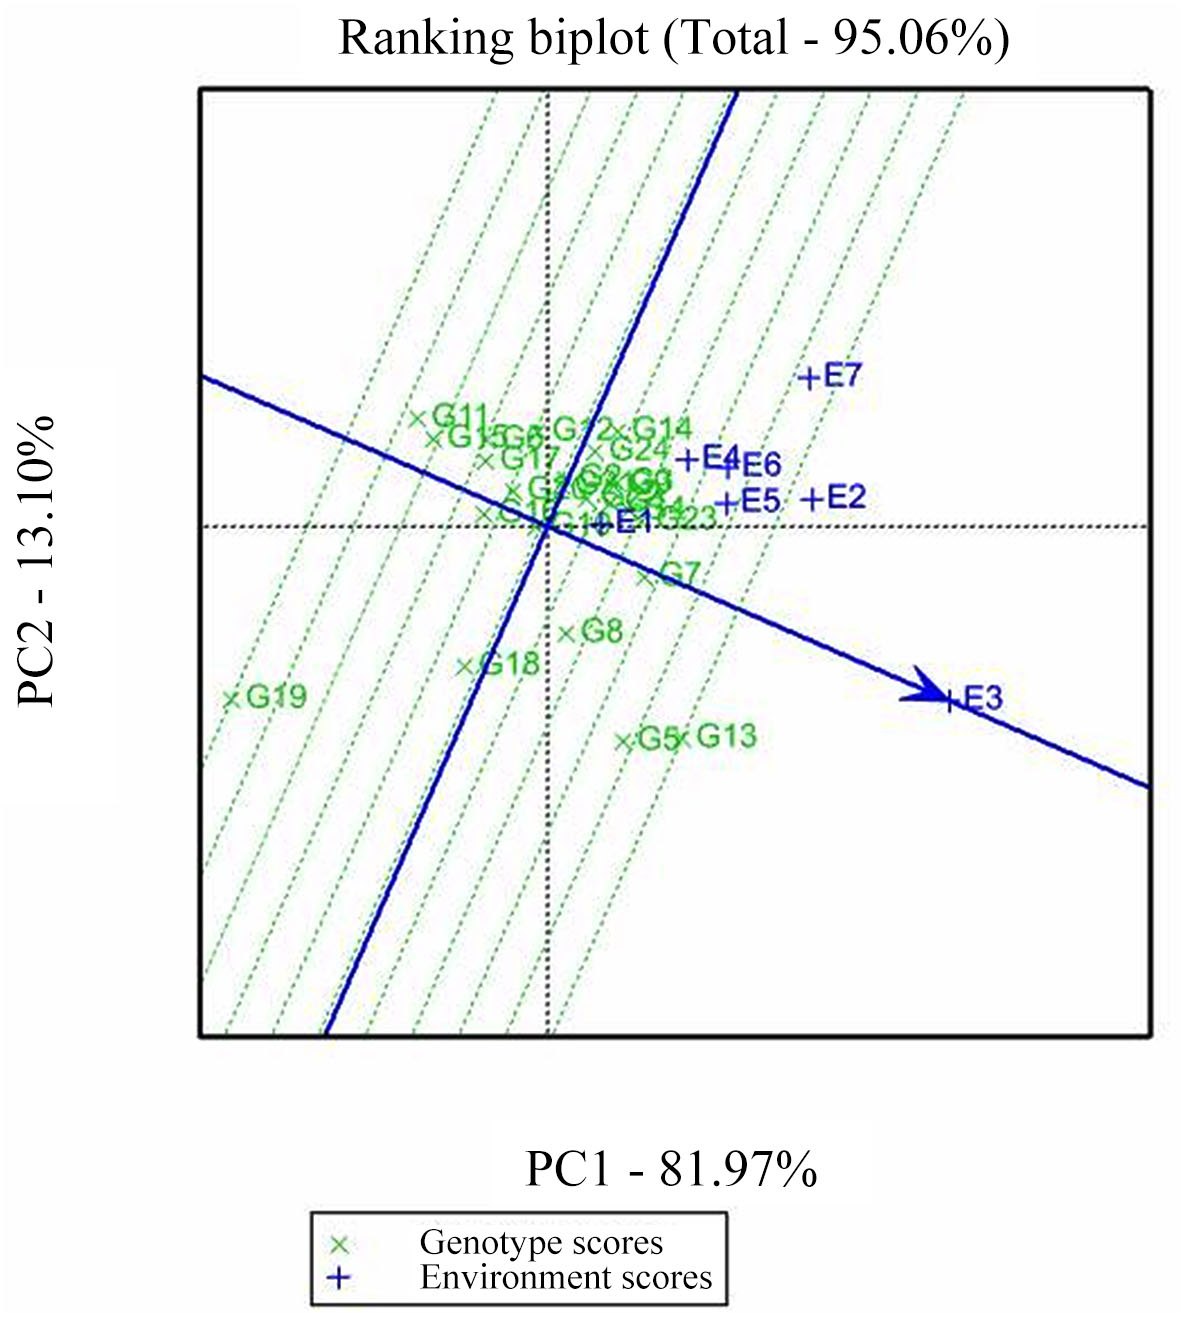
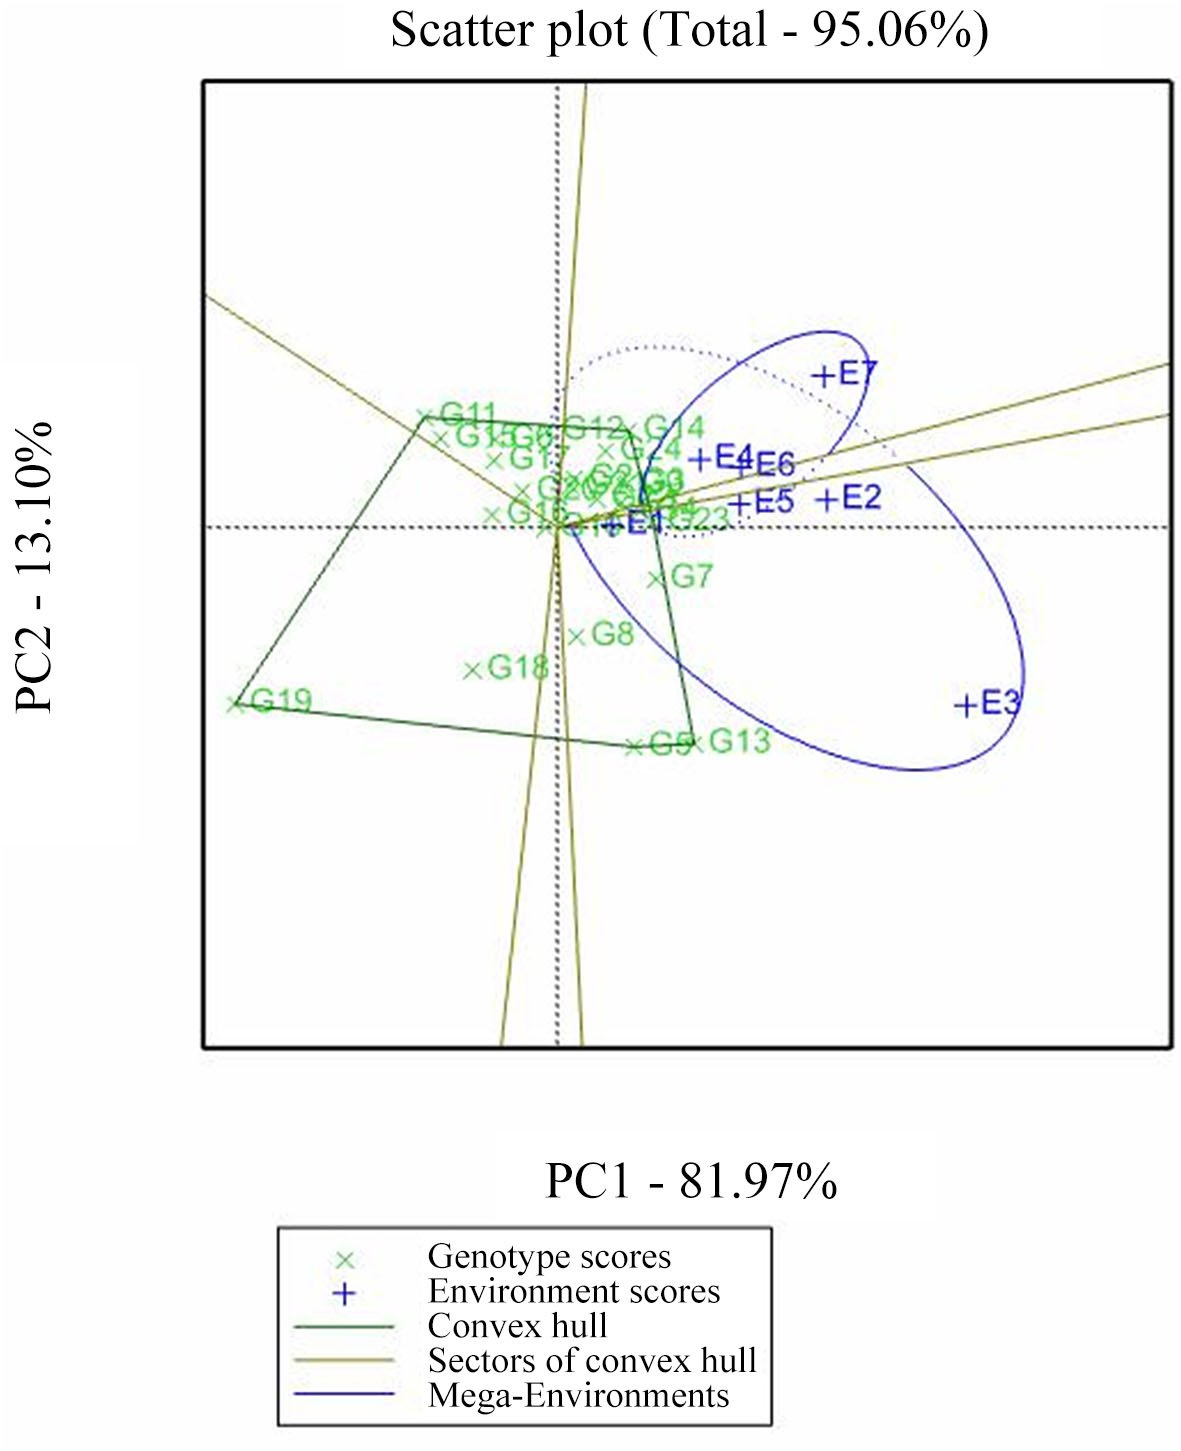
American Journal of Plant Sciences · 2021 · Figure 2A GGE biplot ranks sorghum genotypes for yield and stabilityRanking biplot of sorghum genotypes for grain yield and stability across seven environments in Ethiopia.
All papers shown here are open access. Each figure is reproduced unchanged with credit to the original article and under its licence, shown in the viewer.
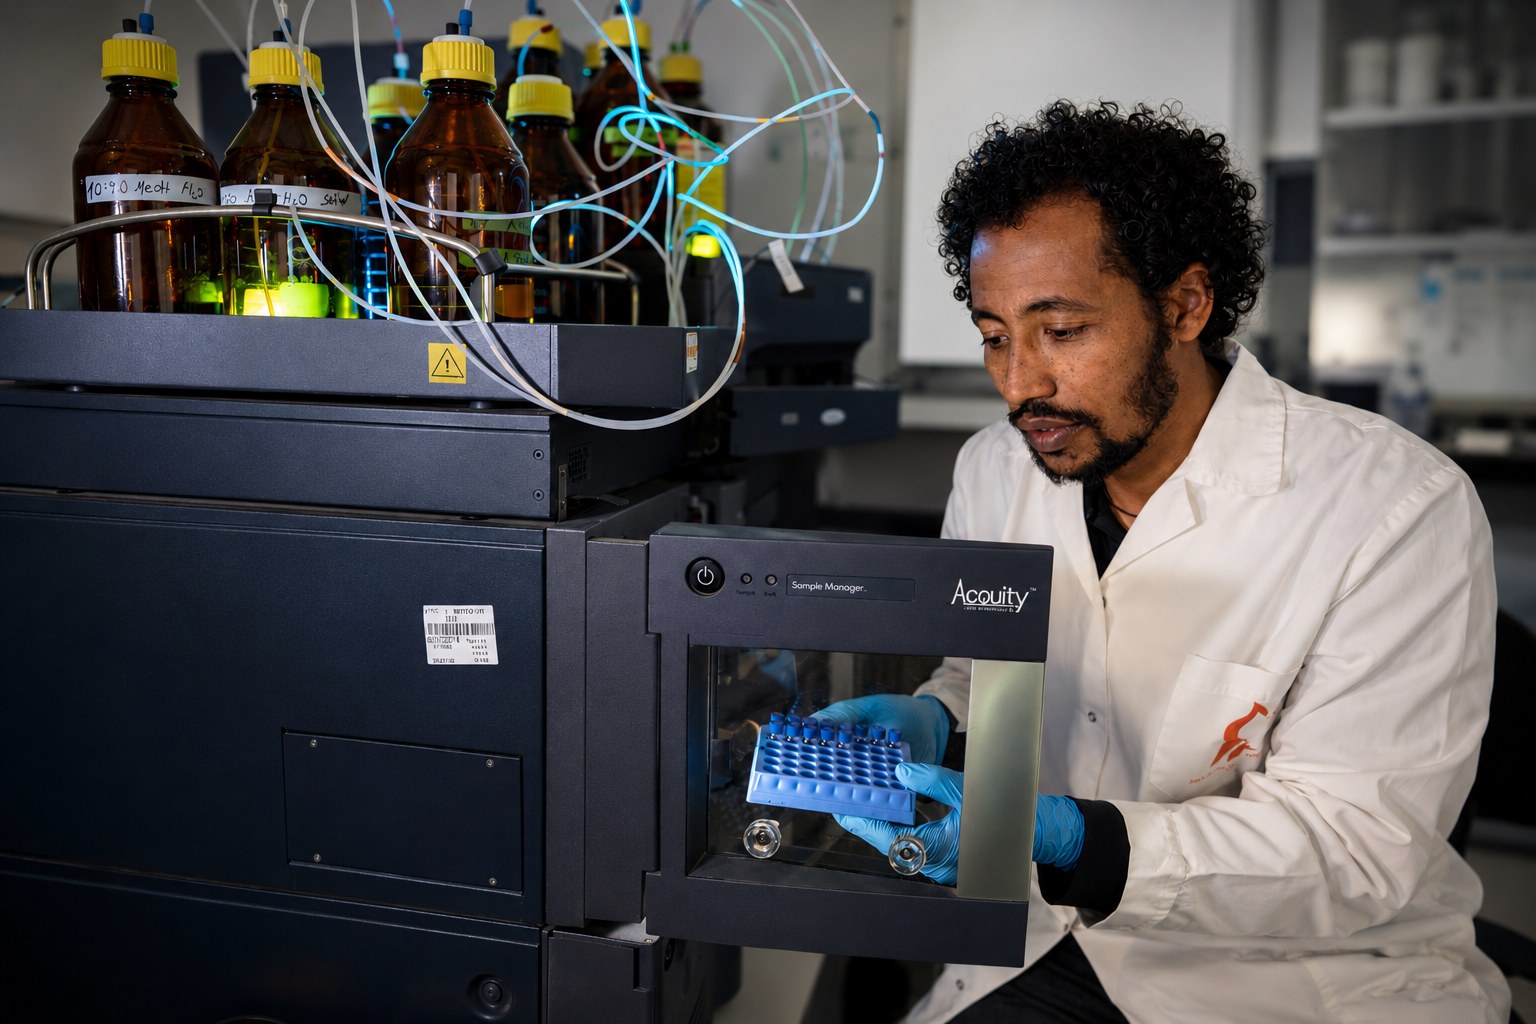
Field and lab photos
Photo captions and final research images can be replaced here as field, lab, and conference images are selected.